Freight rate per mile explained
A carrier-oriented look at how carriers compare revenue against loaded miles, deadhead, and trip cost, with attention to empty miles, appointment pressure, cost exposure, and the next move after delivery.
Written and reviewed by LaneMath Editorial Team, with carrier workflow review from Dale Morrow where practical dispatch, paperwork, or lane-planning context is involved. Updated 2026-06-29. LaneMath pages use public references, example-only math, and conservative editorial review.
Rate-per-mile decision table
Use the table after the broker gives a gross rate. The rows keep mileage definitions and trip assumptions from drifting during the comparison.
| Signal | Why it matters | Next check |
|---|---|---|
| Loaded-mile rate looks strong | The denominator may exclude the truck's approach and delivery-side repositioning. | Calculate the same gross over planned total miles. |
| Mileage sources disagree | Broker miles, routing software, and odometer miles can produce different settlement and planning figures. | Record the source used by the confirmation and the source used by dispatch. |
| Short load has a late appointment | A high rate per mile may still consume the entire workday. | Compare gross per usable day and the reload window. |
| Delivery market is uncertain | The final empty leg is unknown rather than zero. | Use a reasonable repositioning range and test both ends. |
Key takeaways
- Confirm whether the number is loaded-mile or total-mile revenue.
- Separate linehaul, fuel, and accessorials before comparing loads.
- Use example math only after checking real trip costs.
Working frame for freight rate per mile explained
A carrier-oriented look at how carriers compare revenue against loaded miles, deadhead, and trip cost, with attention to empty miles, appointment pressure, cost exposure, and the next move after delivery. The first operating question is whether the subject changes money, time, equipment fit, payment exposure, or the truck's position after delivery. Keep those effects separate so one attractive number does not hide an unresolved condition.
Checks before the truck is committed
Confirm whether the number is loaded-mile or total-mile revenue. Separate linehaul, fuel, and accessorials before comparing loads. Use example math only after checking real trip costs. Write down any term that still depends on a broker reply before dispatch. Confirm the exact commodity, weight, equipment, appointments, facility rules, and approval path that apply to this load rather than relying on a familiar lane or broker relationship.
A quick sanity check before you call back
Write the broker's number in three lines: gross, gross per loaded mile, and gross per total mile. Then add one plain-English note: why this load might still fail. That note might be a late delivery, a weak reload market, a heavy load, or a receiver with a history of slow unloads. If you cannot name the main risk, you probably have not looked at the load closely enough.
Which mileage number is the broker using?
Ask whether the quoted rate per mile uses loaded miles from the rate confirmation, a routing program, or another mileage figure. Then add the empty trip from the truck's current location to pickup. If delivery leaves the truck outside the next usable freight area, estimate that repositioning separately instead of burying it in one mileage total.
A clean rate can hide a messy trip
The common error is comparing two loads by loaded-mile rate while ignoring how each load consumes the day. A short load with a late live unload, two hours of pickup deadhead, and a weak reload can have the better headline rate and the weaker operating result. Rate per mile is a comparison tool, not the final answer.
Write down the denominator
Keep the gross offer, loaded miles, approach deadhead, likely delivery-side repositioning, and the source of each mileage estimate. Add the final rate confirmation and any revised rate. A later review is useful only when it is clear whether the original decision used paid miles or all miles the truck expected to run.
Example scenario
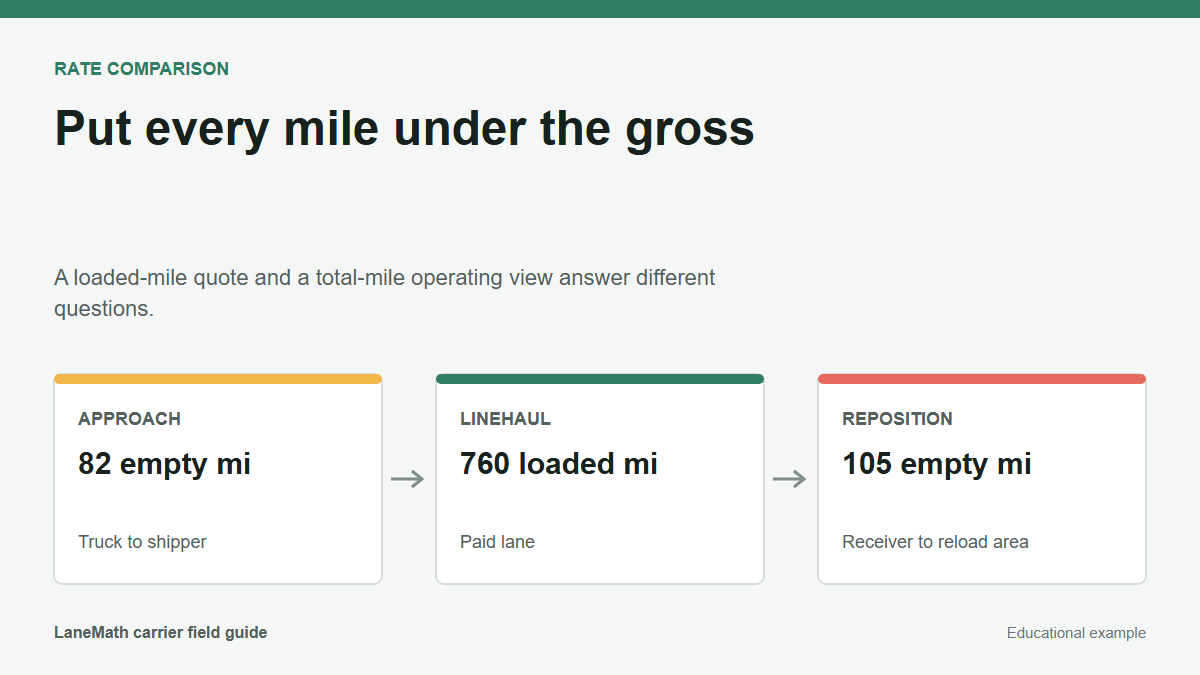
A truck sits 82 miles from pickup. The load pays $2,450 for 760 loaded miles, but delivery is 105 miles from the carrier's likely reload area. The loaded-mile figure is $3.22; the same gross spread across 947 planned miles is $2.59. That difference does not automatically reject the load, but it changes the comparison. The numbers and circumstances are educational examples; replace them with the actual route, written terms, costs, and operating limits for the load being considered.
What to check before booking
- Confirm whether the number is loaded-mile or total-mile revenue.
- Separate linehaul, fuel, and accessorials before comparing loads.
- Use example math only after checking real trip costs.
- Write down any term that still depends on a broker reply before dispatch.
Common questions
Should carriers compare loaded-mile or total-mile rate?
Compare both. Loaded-mile rate explains the broker's linehaul offer, while total-mile rate shows how deadhead and repositioning affect the truck's actual trip economics.
Does LaneMath provide freight quotes?
No. LaneMath uses example-only math and educational explanations. Carriers should replace examples with their actual rate, route, fuel, tolls, accessorial terms, and business costs.
Why does the same rate per mile feel different on a 400-mile load versus an 800-mile load?
Fixed costs — fuel stop time, pre-trip inspection, check calls, pickup and delivery paperwork — stay roughly the same regardless of trip length. Those time costs spread across more revenue miles on a longer load, which often makes a longer run more efficient even at a lower per-mile rate.
Should deadhead miles be included in my rate-per-mile calculation?
Yes, if the goal is an accurate operating estimate. Using only loaded miles shows the broker's rate structure; adding all planned empty miles shows what the truck actually earns per mile driven. Both numbers are useful for different comparisons.
What makes a rate per mile look good on paper but work out poorly on the actual trip?
Common gaps include unplanned deadhead, a slow receiver that consumes hours, a lumper cost not covered in writing, a weak reload market requiring a long empty repositioning, or fuel and toll costs higher than the estimate used when booking.
References and methodology
- Operational Costs of Trucking - American Transportation Research Institute. Used here for: Per-mile carrier operational cost context for educational rate, fuel, and profitability examples.Annual industry report used for general cost-structure background. Not a source for lane-specific rates or broker pricing. Last checked 2026-06-29.
- Industry terminology and editorial explanation - LaneMath Editorial Desk. Used here for: Plain-English definitions, checklists, and example-only calculations.Editorial explanations are not official guidance, legal advice, or market data. Last checked 2026-06-29.